|
||
|
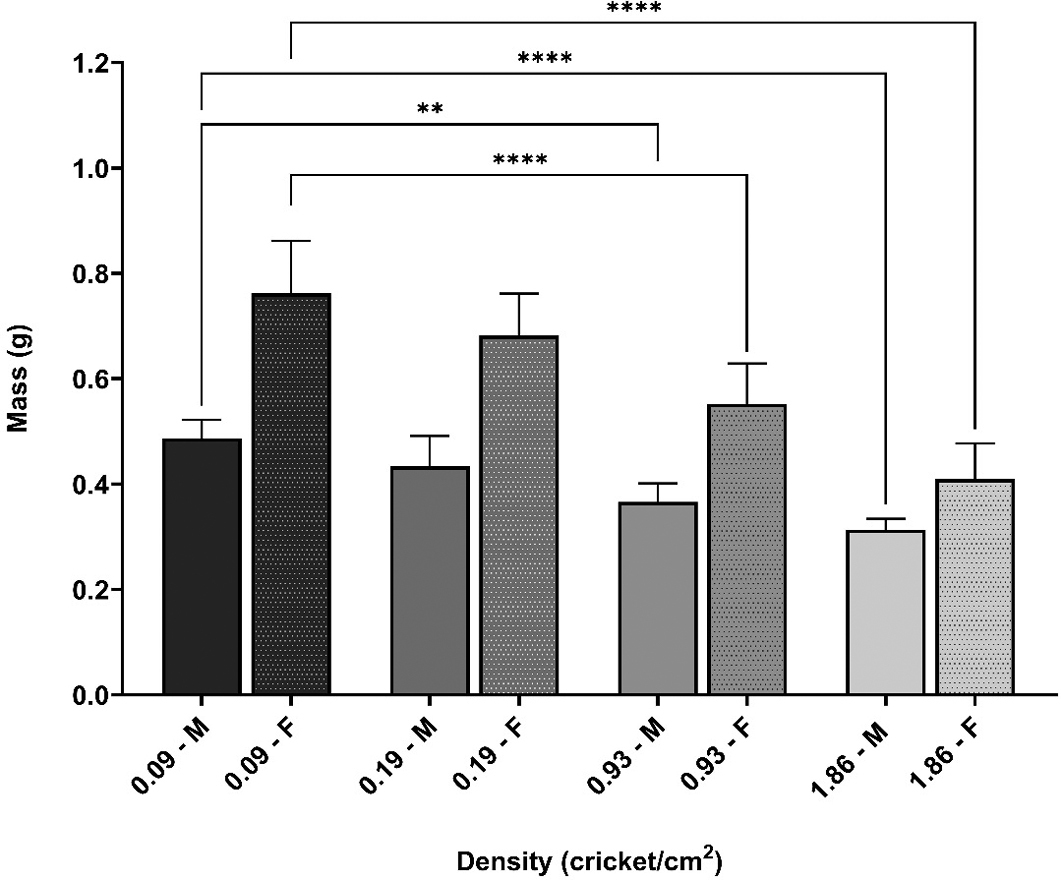
Mass of adult Acheta domesticus used for starvation treatment from each density group. Values represent the mean mass of each group ± SD. The mass of each individual was recorded prior to starvation treatment. A one-way ANOVA indicated significant differences between groups (F (7, 69) = 58.47, p < 0.0001), with a Tukey’s multiple comparison test indicating significantly reduced masses (p < 0.0001) in both the 0.93 and 1.87 cricket/cm2 females compared to the 0.09 cricket/cm2 female controls. Significant reductions in mass were also detected in the 0.93 (p = 0.0018) and 1.87 (p < 0.0001) cricket/cm2 males compared to the 0.09 cricket/cm2 male controls. Although not represented on the graph, between-sex differences (p < 0.0001) were also detected between males and females in the 0.09, 0.19, and 0.93 cricket/cm2 groups. |