|
||
|
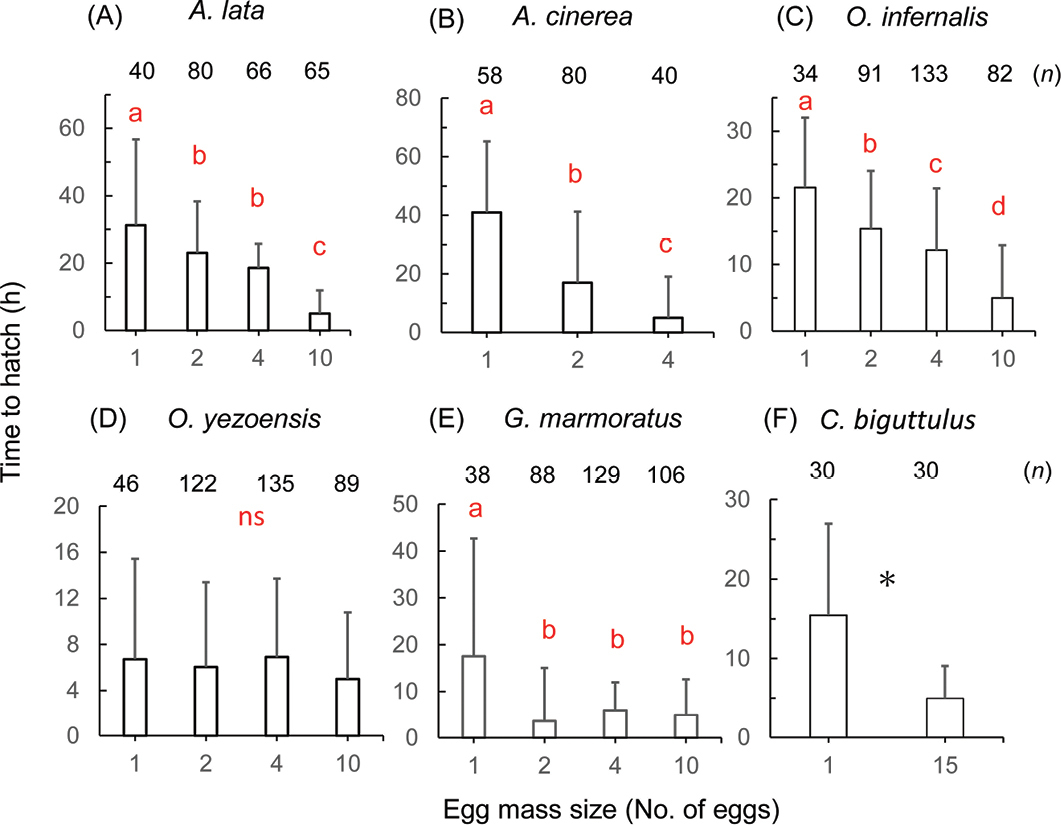
Relationship between number of eggs in a group and mean hatching times in six grasshopper species under continuous illumination and 30°C temperature. For each species, hatching times were normalized by assigning a value of 5 h to the mean hatching time of the largest group. n (number of eggs in each treatment) is given above each histogram. Different letters indicate significant differences in mean values at the 5% level using the Tukey’s multiple test (A–E.) or the t- test (F.). ns indicates no significant difference. |