|
||
|
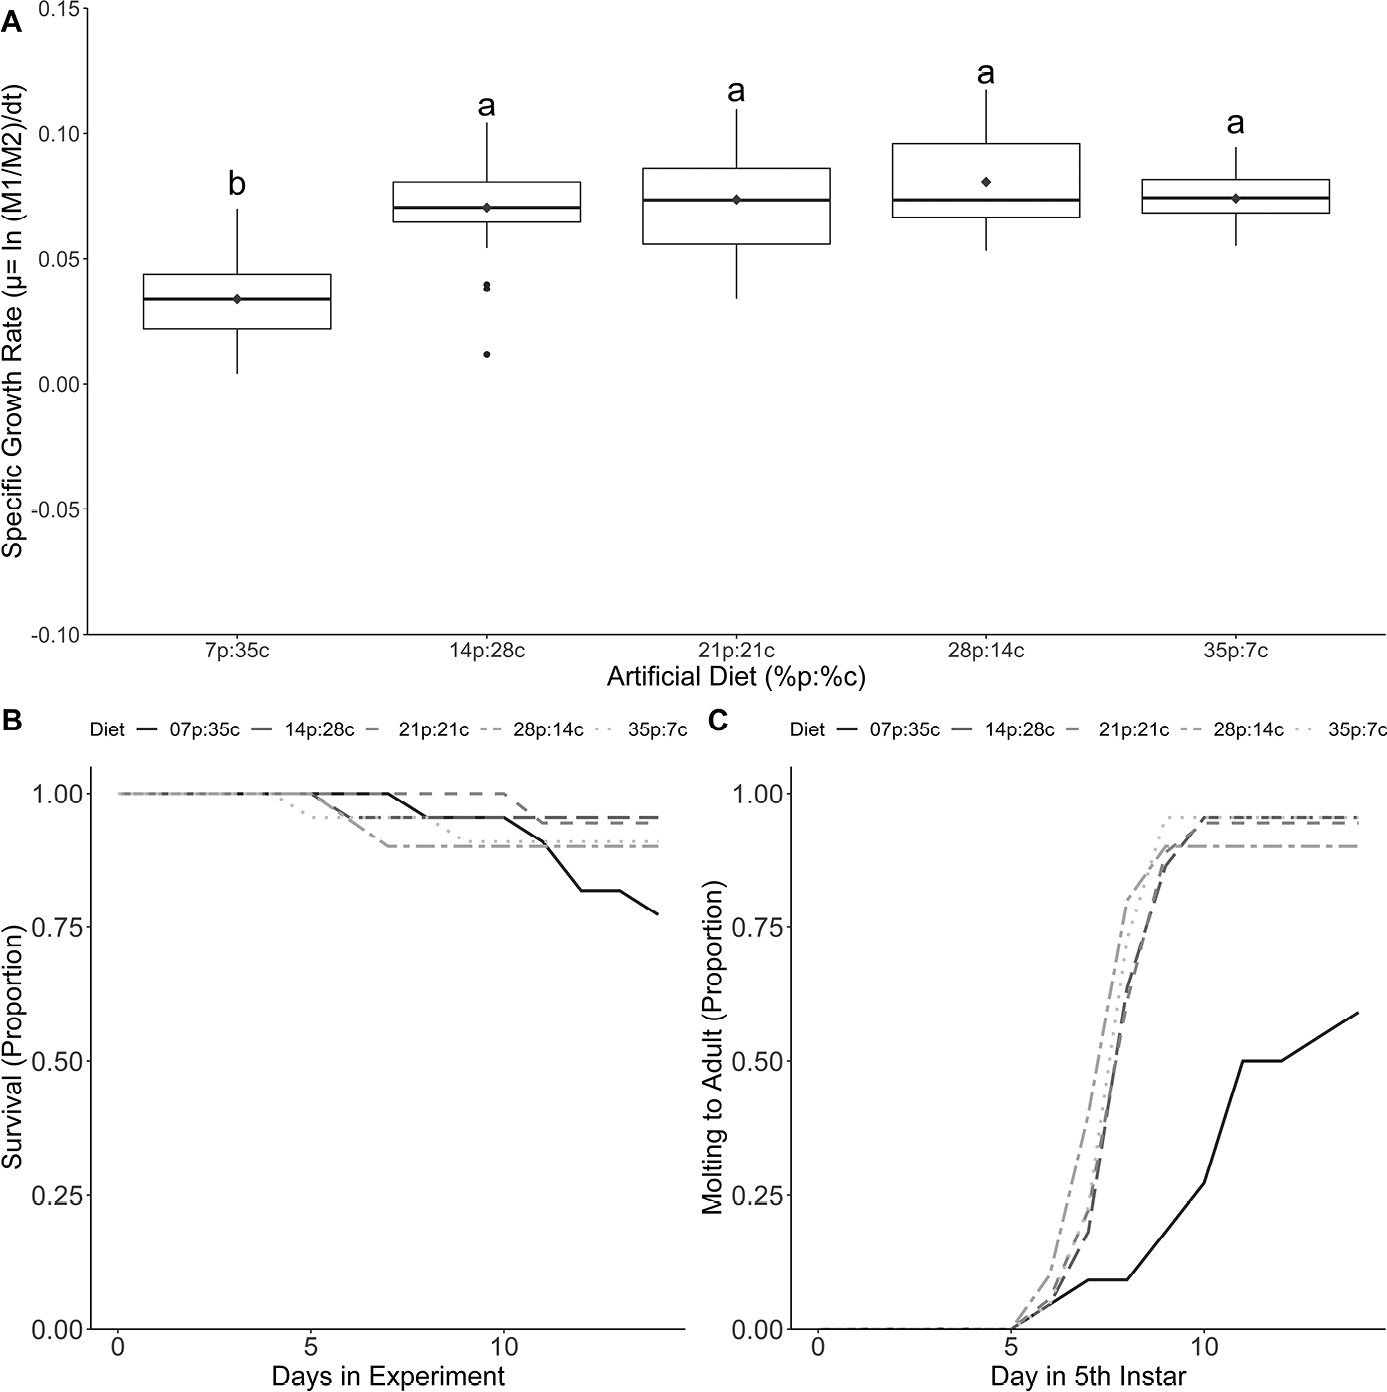
Performance experiments. Survival and specific growth rates of grasshoppers from the long-term lab colony no-choice diet experiments. A. The specific growth rates for each diet treatment. Diamonds indicate the mean and bolded lines indicate the median. Boxes are +/- 25%, lines represent minimum and maximum values excluding extreme values, and dots indicate data points > 1.5 farther from the box edge than the interquartile range. Lower case letters indicate differences from Mann-Whitney post-hoc analyses. B. The proportion of grasshoppers surviving through time on each diet treatment. Most diet treatments did not have individuals die until the 5th day of the experiment, and most treatments except 7p:35c had minimal deaths (although there were no significant differences among treatments). C. Proportion of grasshoppers molting to adults over time. Most of the diets saw increases in molting from days 5–7, except diet treatment 7p:35c, which was delayed and had the least number of grasshoppers successfully molt (significantly different from all other treatments). |