|
||
|
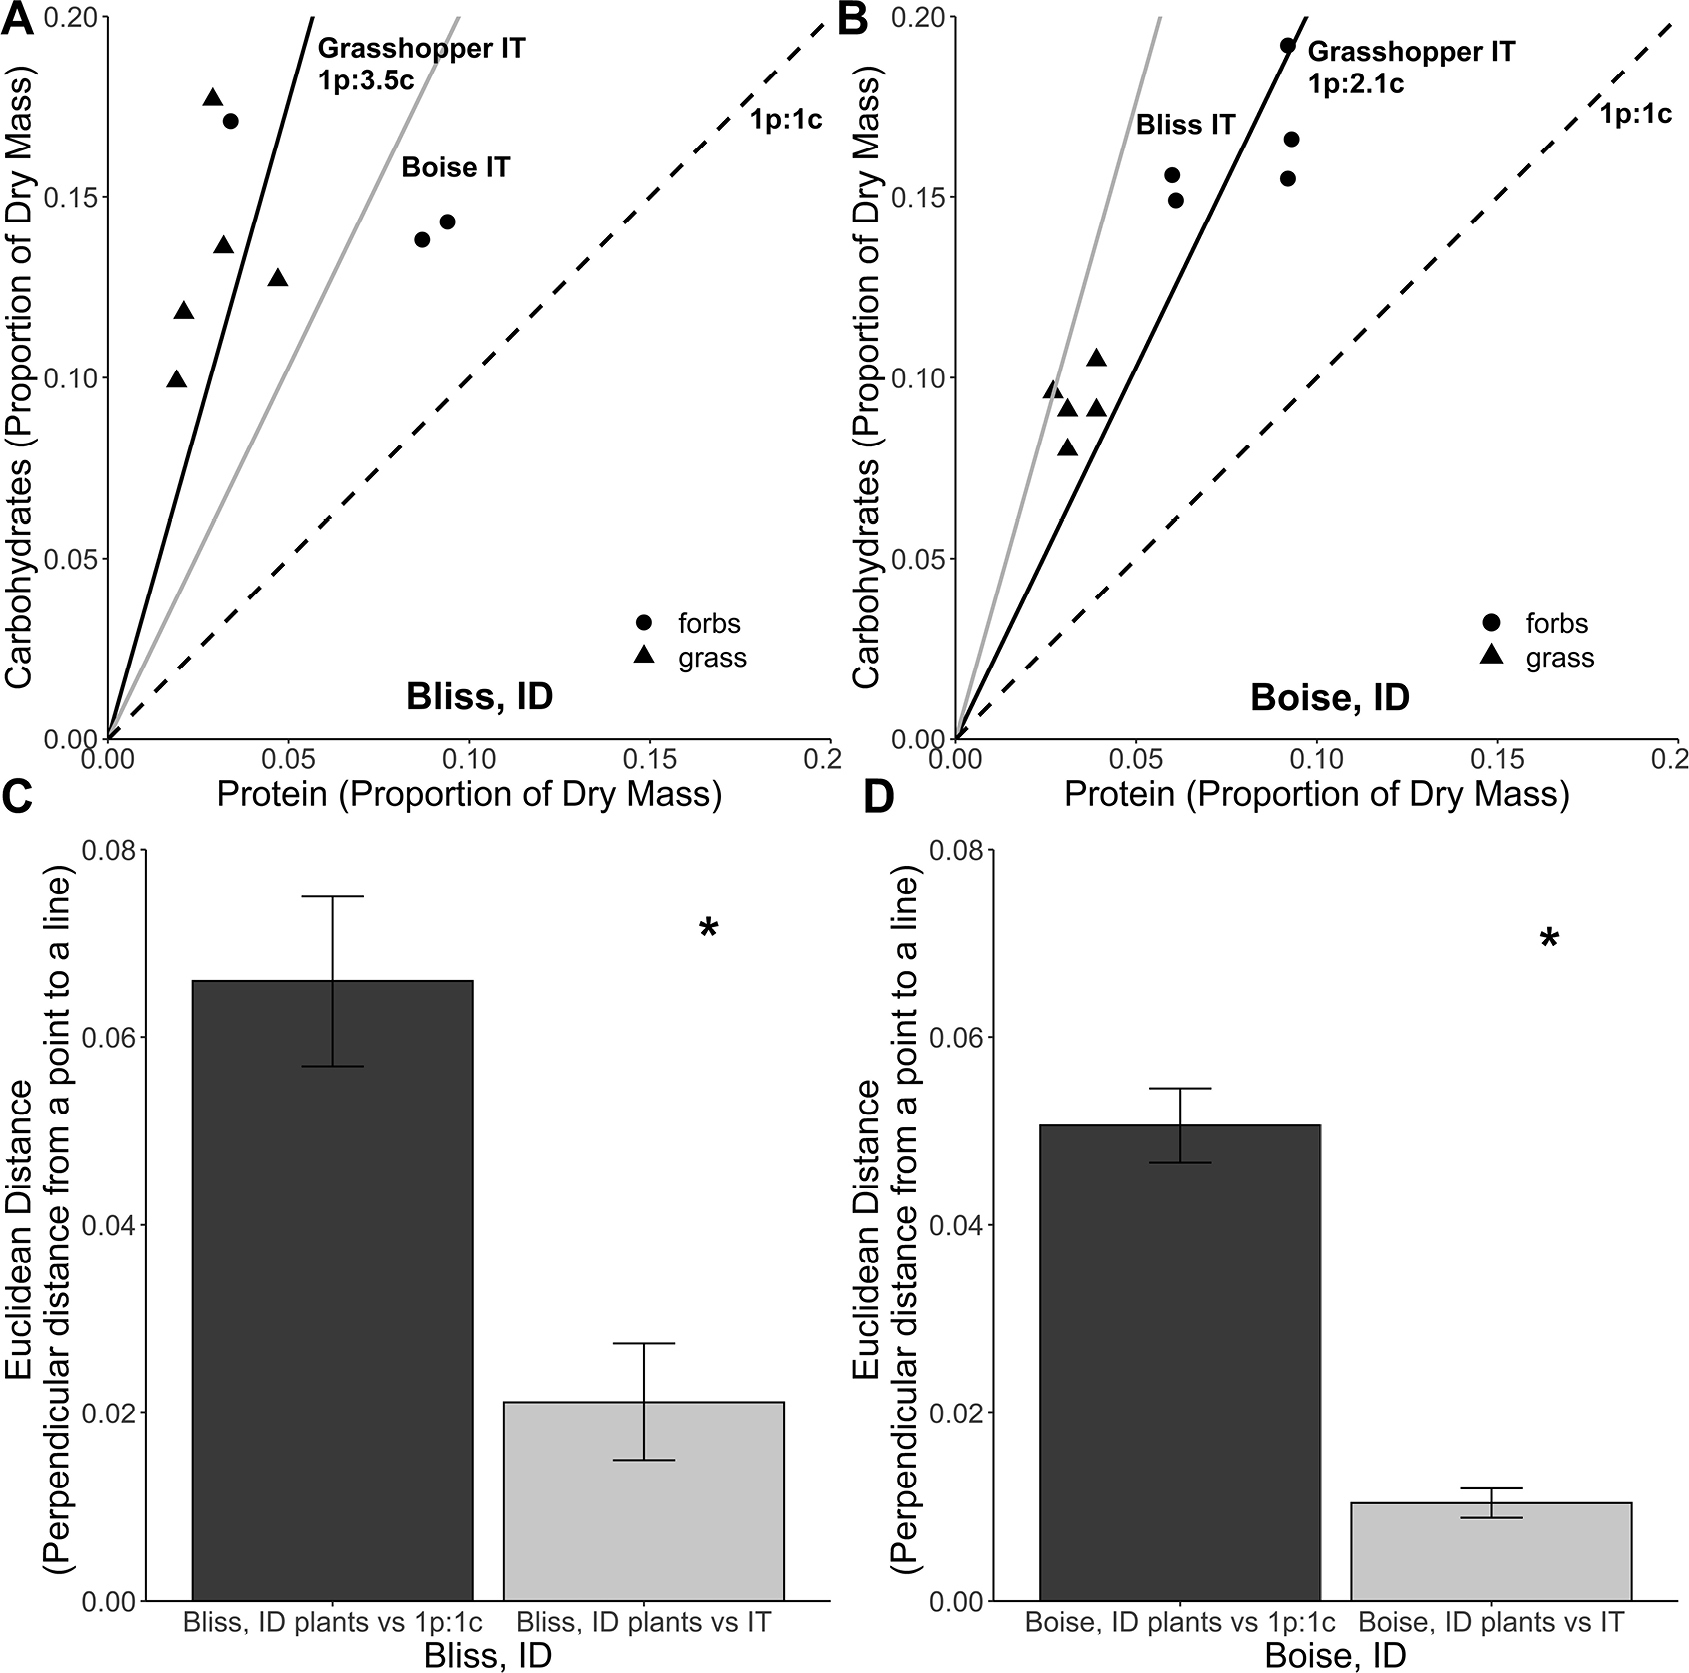
Field IT compared to nutritional landscape. A, B. Grasshopper intake targets of the field populations (black solid line) alongside the nutrient contents of grasses (triangles) and forbs (circles) collected from the same fields. The grey solid line represents the intake target from the other field population. The dotted line represents a 1p:1c ratio. C, D. The average Euclidean distance between the plants (triangles and circles in A and B) and either the grasshopper IT from each location or the 1p:1c line. * denotes a significant difference between the Euclidean distances calculated from the IT and the 1p:1c line. |