|
||
|
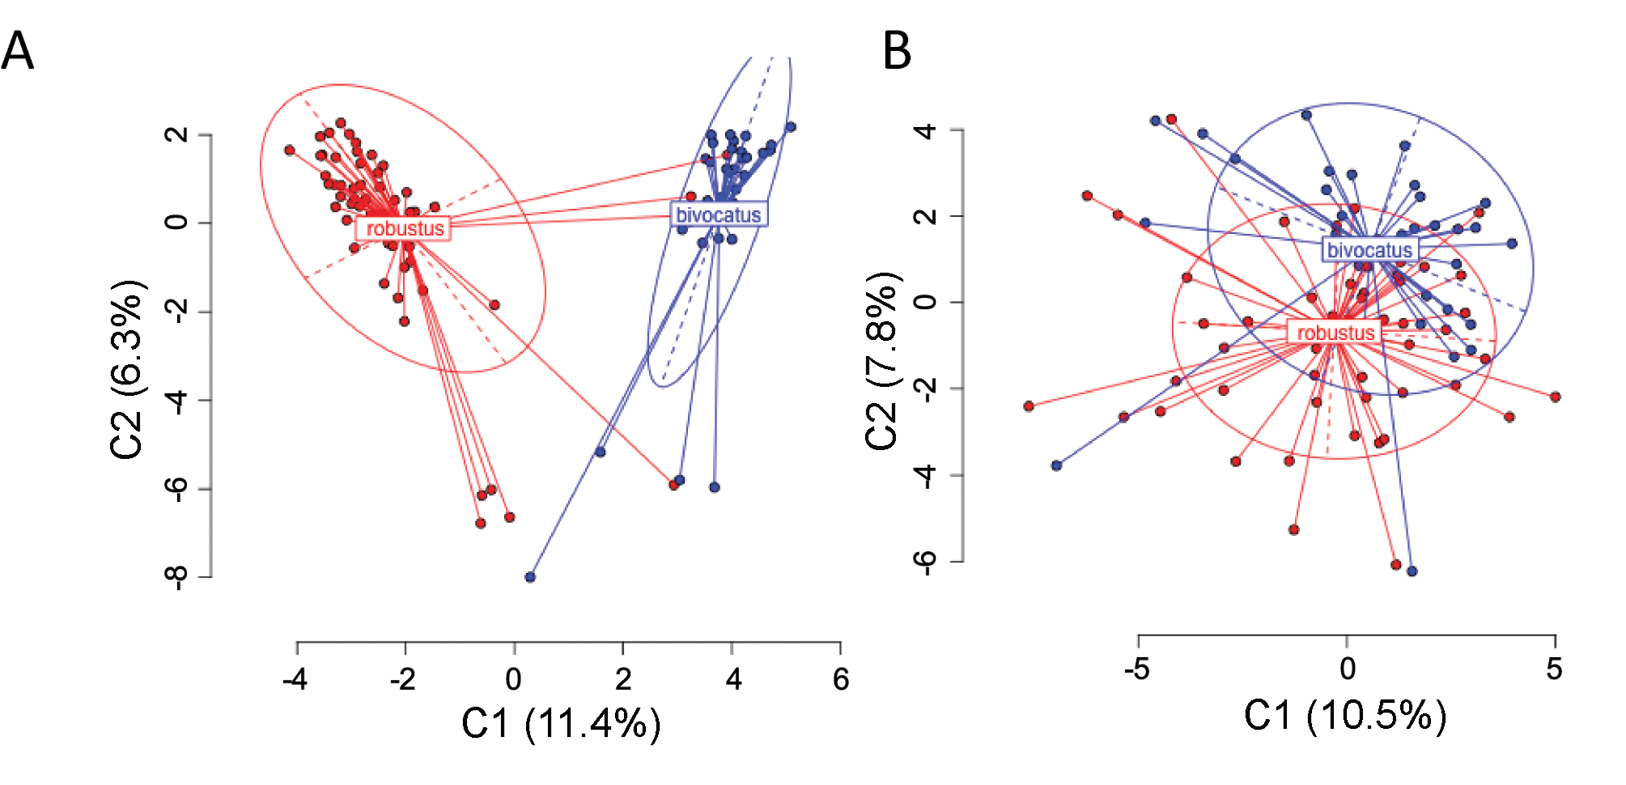
PCoA of N. robustus and N. bivocatus utilizing genetic (A) and epigenetic (B) data. Plotted are the two most informative principal components calculated for the genetic and epigenetic loci datasets, as derived from the MS-AFLP fragment analysis. A. Genetic Euclidean distance with individuals grouped by species assignment. B. Epigenetic Euclidean distance with individuals grouped by species assignment. Group labels show the centroid of the points for each group. The long axis of the ellipse represents the direction of maximum dispersion and the short axis the direction of minimum dispersion. |