|
||
|
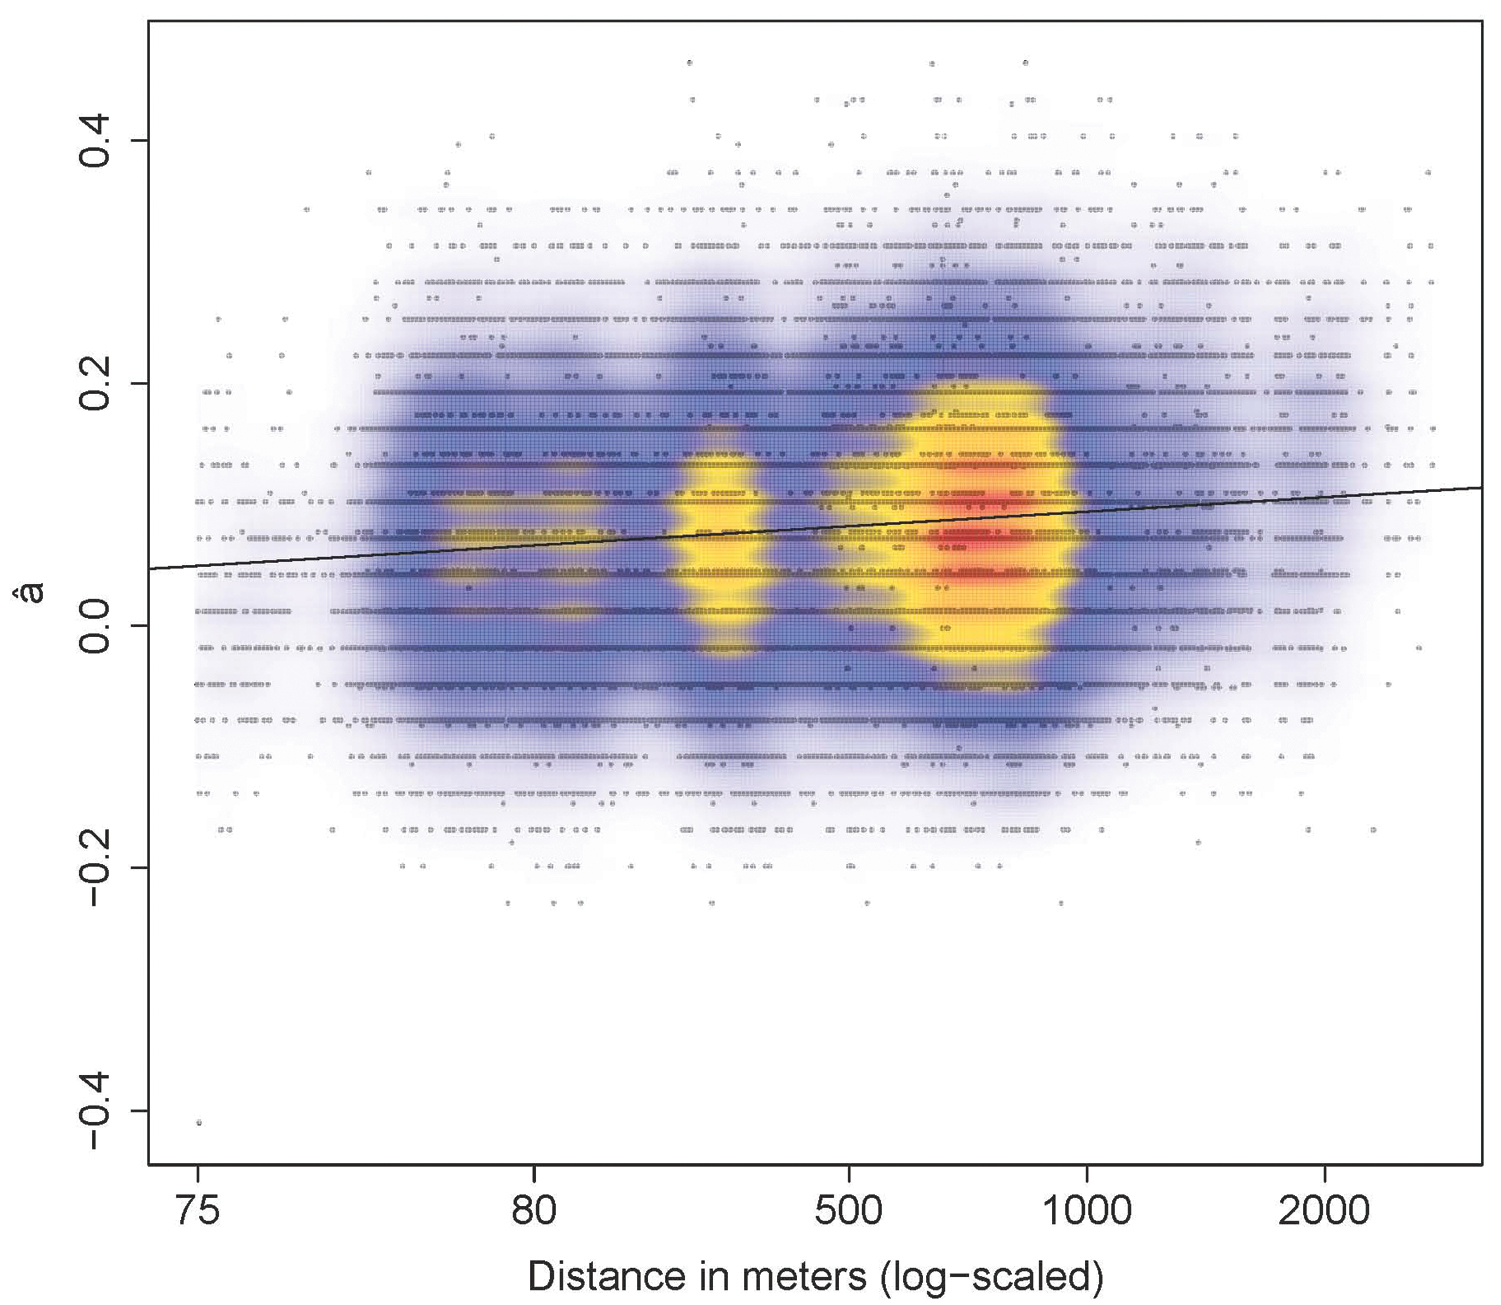
Linear regression between genetic distance â and geographical distances computed between pairs of individuals. Variation in point density is represented by colors, from blue (low density) to red (high density). |
|
||||||||
| Part of: Piry S, Berthier K, Streiff R, Cros-Arteil S, Foucart A, Tatin L, Bröder L, Hochkirch A, Chapuis M-P (2018) Fine-scale interactions between habitat quality and genetic variation suggest an impact of grazing on the critically endangered Crau Plain grasshopper (Pamphagidae: Prionotropis rhodanica). Journal of Orthoptera Research 27(1): 61-73. https://doi.org/10.3897/jor.27.15036 |