|
||
|
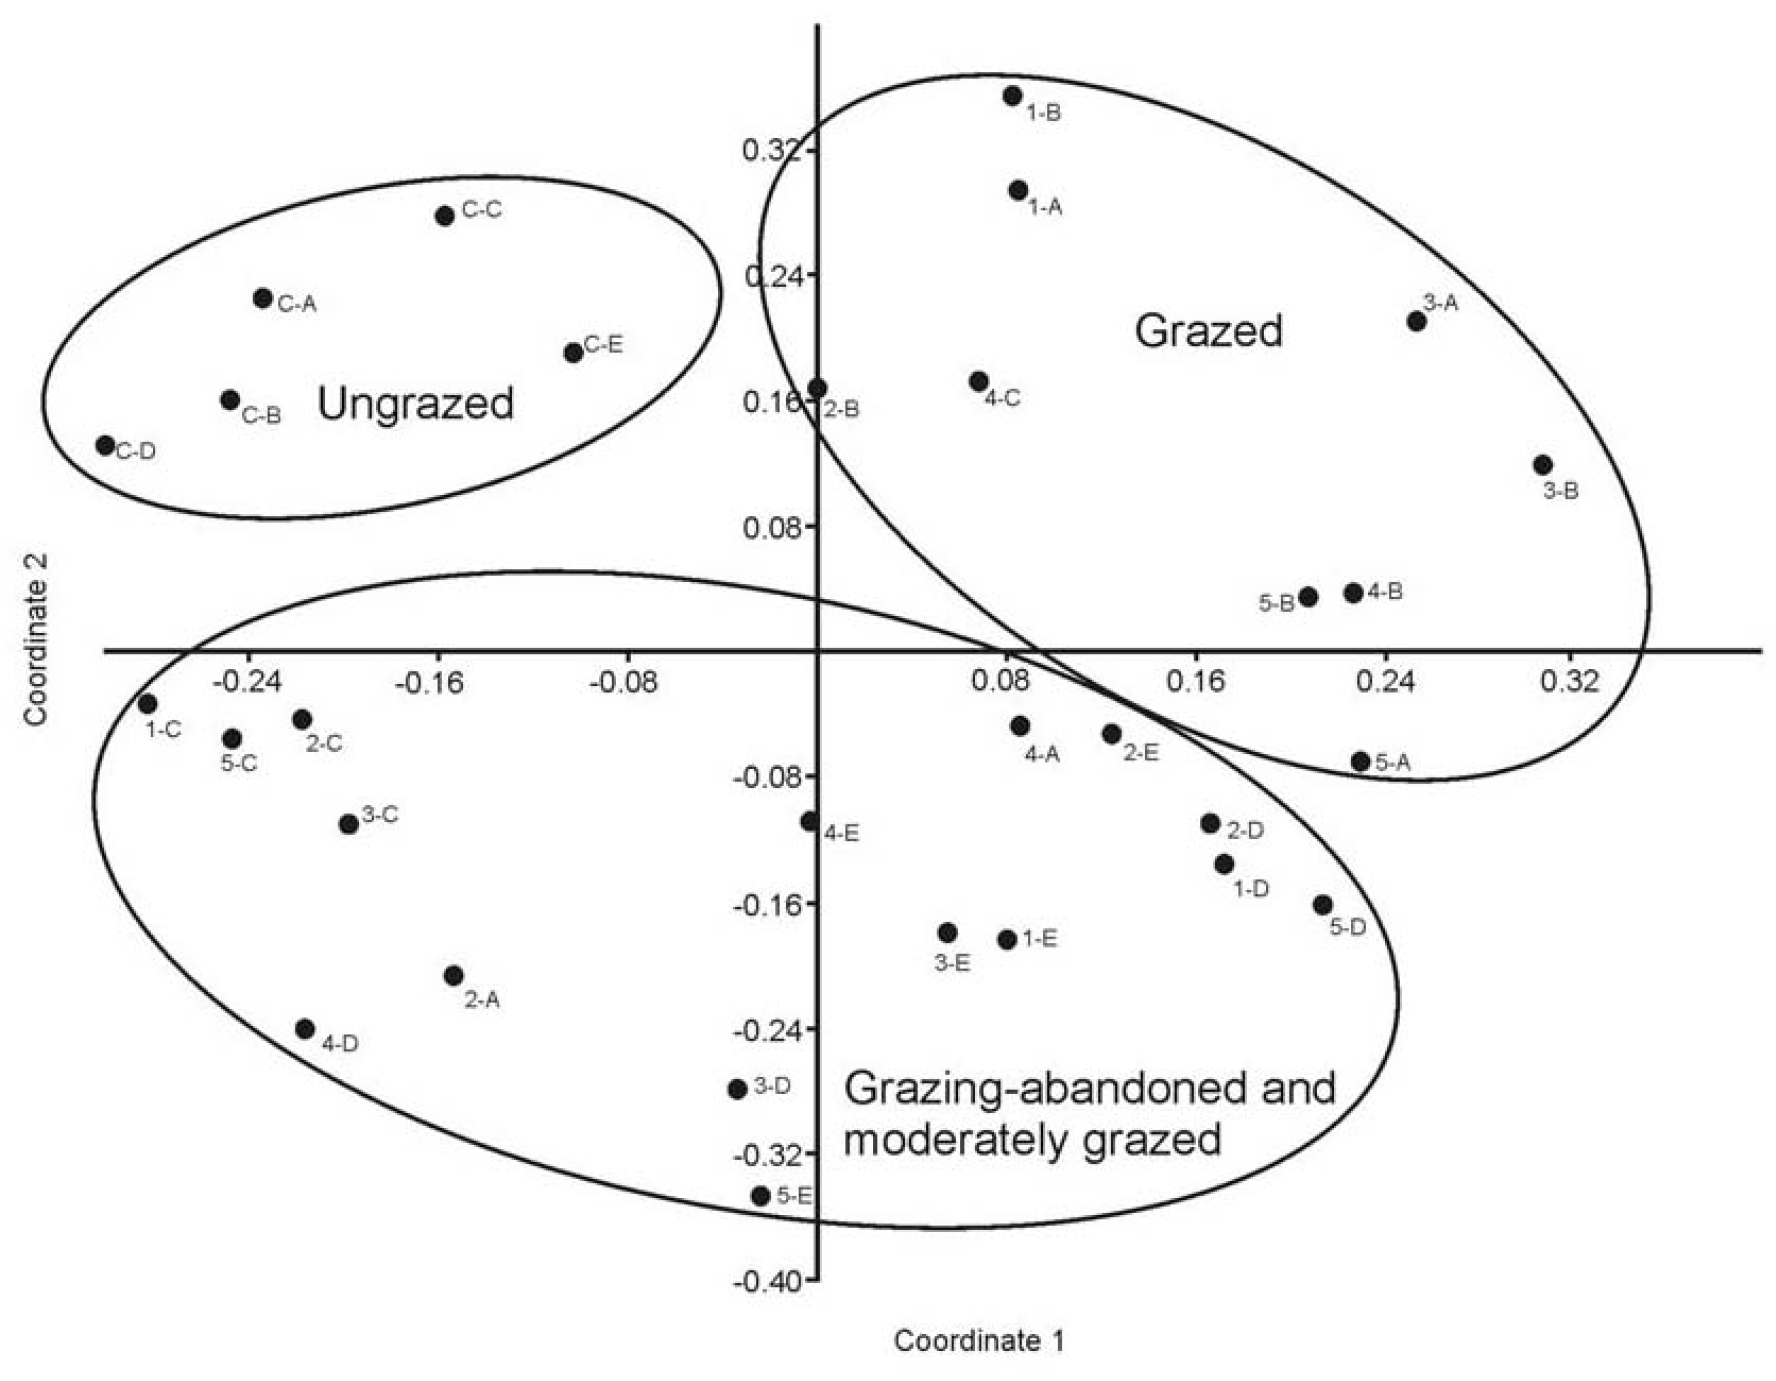
PCoA ordination (sum of all eigenvalues: 20.008, similarity index: correlation) based on Orthoptera data. The different years are marked by A, B, C, D and E (A: 2012, B: 2013, C: 2014, D: 2015 and E: 2016; e.g. 1-A: site 1 in 2012, 2-B: site 2 in 2013, C-C: control site in 2014). |